
If a traveler doesn’t have a destination in mind, then any road will do.

Unlike nomads, serious investors need to determine a destination by establishing realistic goals based on their values, in balance with their personal circumstances. Our goals describe where we want to go and our values define why we want to go there. During this article we will continue to demonstrate how the Wealth That Lasts Process uses your goals as the main focus, and your personal values as the driving force in planning your wealth management strategy.
In past articles we have discussed the topics of values, goals and financial independence. We introduced John and Betty Smith and started the process of developing their values and goals, and their realistic potential of satisfying both. Our job now is to determine whether their goals are realistic, given their assets and the potential returns in the investment markets. As a review, the Smiths have productive assets of $6 million and require income of $360,000 annually from their investments to satisfy their definition of financial independence. Stated another way, the Smiths require an uninterrupted return of 6% percent ($360,000 divided by $6,000,000 = 6%) on their investments to satisfy their desired lifestyle for at least 30 years.
Realistic Expectations
The next step the Smiths should take is to evaluate the type of investments available to them, and also determine the returns that are possible on those investments. At the start, the number of investment opportunities available to investors is seemingly limitless, making the original search very difficult. In future articles we will look at expanded investment types and styles but to simplify the discussion here we will focus on two basic forms of investments, common stocks and bonds.
As stated by David Chilton in his book “The Wealthy Barber,” stocks represent ownership and bonds represent “loanership.” With these two options you can choose to be an owner or a lender, or some combination of both.
Stock
Common stock is simply a form of ownership in a cor poration. Denominated in shares, common stock can be potentially beneficial for investors in two ways: stock price appreciation and dividend payouts. Many corporations have millions, if not billions of shares, so even a wealthy investor’s ownership percentage is usually relatively small, but the investor is still an owner of the corporation. For the purposes of this article, we will restrict our view of stocks to large company stocks represented by the Standard and Poors 500 index. This index is composed of 500 of the largest companies traded on public stock exchanges in the United States.
Bonds
A bond, in contrast to common stock, is not a form of ownership in a corporation. A bondholder is a creditor or lender to a corporation, government or government agency. In the simplest sense, a bond instrument works like an interest only mortgage in reverse. The investor gives the borrower (corporation, government etc.) a lump sum of money up front and in return, receives interest payments over a fixed period of time. When the pre-determined period of time has ended, the bond matures and the borrower pays the original investment back. With a bond, the investor becomes the bank and the corporation, government or government agency becomes the borrower. With bonds, in contrast to stocks, the investor has no ownership interest in the company unless there is a default but under normal circumstances the bond holder is simply a creditor. For the purposes of this article we will look at bonds as the 20 year maturity United States Treasury bond.
What’s Next?
 Now that two investment instruments have been identified we will examine their return characteristics. As we start to try to determine our expected rate of return for an investment type it is important to use a large sample size of yearly returns as opposed to a short, specific period of time. Far too often, investment companies market the returns for their products based on a short, biased period of time. As Mark Twain said, “Figures don’t lie but liars figure.” Most financial professionals have the ability to evaluate the long-term probability of success or failure of investments based on a very large historical data sample. This should all be reviewed before investing.
For example, If we were to evaluate the Smith’s possible success by focusing exclusively on the period during the latter half of the 1990s, in could be concluded that it would not be difficult to achieve an uninterrupted return of 6 percent, because bonds had an average return of 6.20 percent during that time and stocks had an average annual return of 28.7%. Both returns have exceeded the needed 6 percent and would indicate that success is easy. If, however, the time frame used to evaluate the Smiths possible success were the years 2000 and 2001 or 2007 to 2009 it would seem impossible because the aggregate returns during those periods of time not only didn’t match their return requirement of 6 percent they were negative. Recent positive or negative history tends to alter some investors’ view of what returns can be achieved so a much larger period of history is necessary to come to a fuller understanding of average returns and range of returns.
I feel that a thorough timeframe to use when evaluating possible investment return is the period from 1926 to the present. This 85 year period is considered the era of the modern markets and it incorporates numerous economic, political and social events so returns may be viewed throughout various cycles. During the time period mentioned, large company stocks as represented by the Standard and Poors 500 index have returned about 9.9 percent and bonds as represented by the United States 20 year maturity Treasury bond have returned about 5.5 percent. These average returns are as calculated by Ibbotson Associates in the 2011 yearbook titled “Stocks, Bonds, Bills and Inflation.”
Given that the average return for stocks has been 9.9 percent and the average return for bonds is 5.5 percent, it would seem that the Smiths could achieve their desired return of 6% using a combination of stocks and bonds. An obvious question occurs from reviewing this data, “If stocks average return is 4.4% higher each year than bonds why would we buy anything but stocks?” I will address that question in the next two articles. Up to this point we haven’t considered the potential costs of inflation, taxation or investment fees so let’s look at the impact these may have.
Added Costs: Inflation, Taxation, and Investing Expenses
Now that the basic probability of success has been addressed, it is important to evaluate whether a return of 6 percent will really achieve the Smiths’ long term goals. Far too often, investors overlook added costs that are imperative to understanding the true cost of investing in relation to the return necessary to satisfy their goals. Let’s add these expenses to their lifestyle needs and reevaluate. First, taxes in this example will add 1.25 percent2 inflation or decreased buying power is estimated at 2.75 percent3 more, and we will assume that investment expenses will add 1 percent more. These need to be added to their lifestyle needs of 6 percent to determine the total return necessary. Please refer to the following chart for this example.
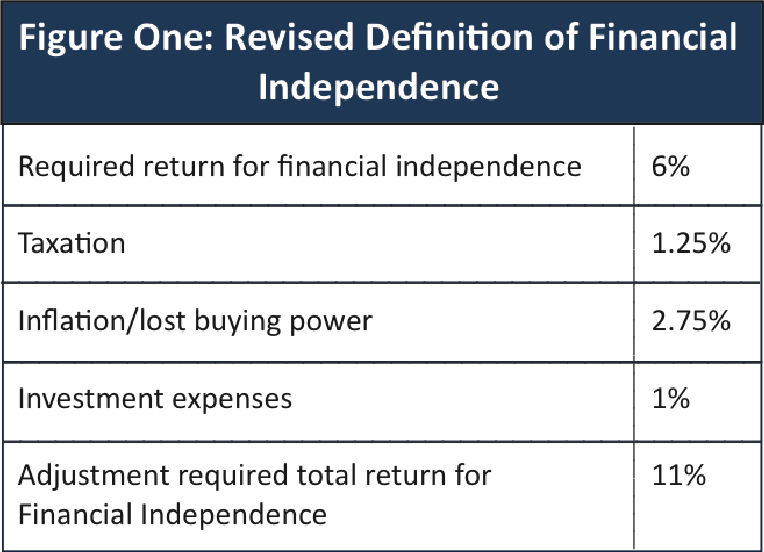
This means that the Smiths do not need 6 percent to satisfy their goals, they will need an 11 percent return each year without interruption for the rest of their lives. As shown, it is important to take a big picture approach to investing. Not only is it important to understand the raw returns necessary to determine the probability of success, it is important to understand all potential expenses and hidden costs that are associated with investing. It can be concluded that the probability of success for John and Betty Smith is at best uncertain. The Smiths may need to a.) Consider reducing their requirements, b.) Continue to accumulate financial assets until they are sufficient to produce the required income or, c.) Some combination of both of these adjustments.
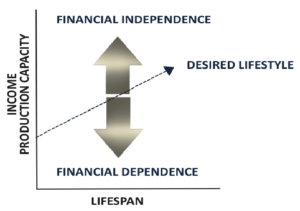
With these new issues in mind I have redrawn the financial independence chart to reflect the potential effect of inflation. In a world that expects inflation it will cost you more for the same lifestyle year after year.
Now it’s time to apply these new concepts to your personal situation. To do this, you will need to print a copy of the “Personal Information Worksheet” by clicking on this link. Complete the information requested and gather the statements and information listed. When finished attach them to the previous information gathered. These will all be combined to create your Net Worth Statement.
To this point we have discussed values, goals and financial independence. These have been paired with the realistic potential of the investment markets including market returns and additional costs. You can move to the next article titled “Risk is a Four Letter Word,” by clicking on this link. We will look at the effects of risk in the determination of one’s tolerance for volatility.
I am interested in your feedback. If you have questions or comments please contact me directly at Bob.Bancroft@wealththatlastscourse.com
1. Investment products are in no way limited to stocks and/or bonds. We will discuss several other investment types in other articles.
2. 1.25% is for illustration purposes only; it does not represent any specific tax rate or calculation. Moreover, Global WMI, LLC does not provide tax advice.
3. 2.75% is for illustration purposes only; it does not represent any specific figure or calculation.