
We have been working through the elements of the Wealth That Lasts Process during the past few articles. The purpose of the process is to block out the ‘noise’ that comes from the scattered, disconnected investment information that bombards us every day. The financial services industry has focused most of its attention on marketing to potential clients rather than on educating them. This type of marketing is typically based on fear or greed and is intended to make investors uncomfortable and willing to change their existing investment structure. Because the marketing of investment products can be subjective, Global WMI attempts to add a level of objectivity to the investment process by providing educational resources to affluent individuals, families and their fiduciaries.
As investors, we want high returns and certain outcomes. However, as we discussed in previous articles, returns in the short-term are unpredictable and risk/volatility is a reality. We explored the discovery and development of Modern Portfolio Theory (MPT) from 1952 to the present. We generically call this section asset allocation, but in this article we are going to focus on the tools of MPT. The tools include: standard deviation, diversification, correlation, asset allocation and efficient frontier. We are going to define these tools and discuss how you and/or your financial advisor may use them in the implementation of your wealth management strategy.
MEASURING AND MANAGING RISK
Tool #1: Standard Deviation
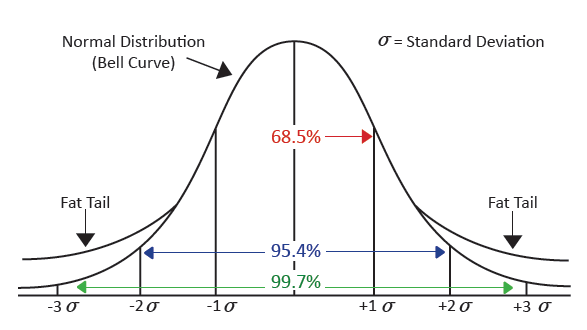
 In or around 1730, a gentleman named Abraham de Moivre developed the concepts of normal distribution and standard deviation. By looking at large sets of data, such as the deaths in London, he could determine the likelihood that a certain person of a certain age would die in a given year. He was not attempting to determine that a particular person would live or die, but rather how many would die out of the population as a whole. If the people selling insurance were insuring large enough num-bers of people, de Moivre could approximate the number of those insured that would die in a given period of time. With that understanding, the insurers could attempt to quantify the risk and set appropriate premiums to charge individuals for life insurance.
In my work I need to know the potential returns of particular investments rather than probability of death, but the calculation methodology is similar. In a perfect world I would be able to determine the exact return of my investments in advance, but that is impossible so I look for alternatives. One method is to study the historical returns and determine the range of positive and negative extremes from the average over a given time period. To be valid, the range of possible returns requires a sufficient amount of historical data. If the returns in that data are normally or approximately normally distributed, we have a tool that will allow us to establish the probability of positive and negative outcomes around the average. The tool that we use is called “standard deviation.”
When looking at an individual’s tolerance for portfolio volatility, an advisor can use standard deviation to determine the likelihood that a portfolio of a certain construction would perform below that investor’s tolerance for volatility in a given year. If the portfolio proves that it has the potential to be volatile beyond the individual’s tolerance for downside volatility, the portfolio construction can be altered or avoided which helps the investor avoid the emotional and costly mistake or reacting to volatile markets.
For example, using data from 1926 to the end of 2010 supplied by Ibbotson Associates, “Stocks, Bonds, Bills and Inflation 2011”, investors can see that the 85 year average return for large company stocks represented by the Standard and Poors 500 index was 9.9 percent. As we have said previously, the average of 9.9 percent doesn’t occur every year because the returns are inconsistent. The question that we need to ask ourselves is, “in the search for high returns, how much inconsistency am I willing to tolerate?” If one determines that they are not willing to tolerate annual returns worse than negative 15 percent in any given year, then they have a solid starting point.
 By examining large company stocks we can determine the dispersion of returns around the average of 9.9 percent. The standard deviation of large company stocks as measured by the S&P 500 Index is estimated at approximately 20 percent. Without going into a great amount of detail, that standard deviation of 20 percent tells us that statistically there is a one in 40 chance of seeing a return above 50 percent and also there is statistically a one in 40 chance of seeing a return below negative 30 percent. This look at standard deviation begins to be useful for our planning purposes because if our downside volatility tolerance is limited to a downside return of negative 15 percent, a portfolio construction that expects a return of negative 30 percent should be avoided, or at least modified by investing a portion of the portfolio in cash and/or other asset classes that are less volatile. By knowing this tolerance for volatility before investing, one can alter their investment structure, avoid a major mistake and avoid a significant amount of anxiety.
Tools #2 and #3: Diversification and Correlation
“Diversification,” as Nick Murray said, “is the conscious decision to avoid making a killing for the certainty of not getting killed.”
It is nearly universally agreed that diversification is a good thing, but diversification, in my opinion, is the most over used and least understood words in the investment world. Many articles focus on the apparent necessity of diversification but fail to define it properly. It is assumed that since the word has such a significant place in common use that everyone knows what it means, so further definition is unnecessary. I disagree with that view and will attempt to explain the most important parts of its use here.
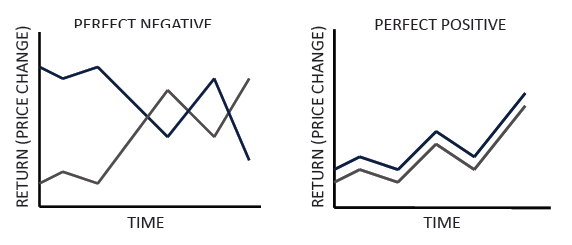
Common sense of the word diversification can be captured in the phrase, “don’t put all of your eggs in one basket.” The meaning of the phrase as it applies to investments is that if one were to hold several different types of investments or hold investments in different places they would be diversified and that’s not necessarily true. As an example, if an investor owns securities, including the common stock of Coca-Cola and Intel, is he/ she working toward being diversified? On the surface it may appear that they are because Coke and Intel are different types of companies. Coke is an internationally known beverage company and Intel is well known for their computer chips. However, there is a further concept that is necessary to understand before one can make that determination regarding diversification and this concept is “correlation.” Correlation measures the degree to which the movement of one security explains the movement of another security. If securities such as Coca-Cola and Intel move up and down at the same time, then no level of diversification has been achieved. The gain or loss in one of the assets will explain the gain or loss in the other. As in the illustration below I have provided two types of correlation, perfect negative and perfect positive.
If two securities or security types have perfect negative correlation the return and volatility of one wipes out the return and volatility of the other so there is no return, no volatility and the investor ends up paying investment expenses and achieves a negative return. With perfect positive correlation when one investment is going up or down so are all of the other investments so there is no diversification.
If, on the other hand, both securities have acceptable positive returns over time and the movement of one does not explain the movement of the other, then the true benefit of the diversification can be achieved. In other words the diversification effect is achieved by combining assets or asset classes in such a way that the volatility of the group of securities is less than the weighted volatility of average security in the portfolio. An example of non-correlated assets is illustrated below.

That last point is worth repeating. If one is constructing a portfolio of securities that don’t all
move up and down at the same time the combined portfolio will have lower volatility than the average security in the portfolio. By diversifying properly one avoids the possibility of a total loss of their investment but also reduces the average volatility of their entire portfolio. That is the true benefit of the diversification effect.
Tool #4: Asset Allocation
Asset class differentiation is the categorization of different investment vehicles, separating their risk and return characteristics from one another. Examples of asset classes that we have discussed so far include cash, bonds and stocks. We will expand our view of asset classes as we move forward. Asset Allocation, our fourth tool, is the blending together
of these different asset classes to achieve a portfolio structure that provides the required or desired level of return while satisfying the investor’s desired or required tolerance for volatility.
Why do I care about asset allocation? 1986 research by Gary Brinson, L. Randolph Hood and Gilbert Beebower, studied the performance of 91 large U.S. pension plans between 1974 and 1983; Brinson, Beebower and Brian Singer published a follow-up study in 1991 that essentially confirmed the results of their first paper. Both studies were published in the Financial Analysts Journal. They were attempting to learn whether portfolio return comes from investor skill or from the natural return of the market. In their research, the investors they were monitoring were professional portfolio managers. They were trying to determine how much of the positive and negative return experienced in a portfolio was attributable to the market moving up or down and how much came from the professional manager’s skill. They defined manager skill as the ability to add value to the portfolio in such areas as security selection, market timing, portfolio construction, etc. The illustration below is an example of asset allocation using equal portions of the asset classes; cash, stocks and bonds.

A good way to think about BHB’s work is with an analogy. Imagine traveling down a river in a small aluminum boat powered with oars, like the one my father and I used to fish in when I was a boy. If the water in the river is moving at nine mph and we are moving with the current, how fast will the boat floating on that river be moving? The boat will be moving along with the river’s current at approximately nine mph unless there is a person in the boat rowing. If the person is a skilled rower and going with the current the boat may be traveling at ten mph. The contribution of the rower is the additional one mph above the nine mph speed of the river not the entire ten mph that the boat is traveling.
What their ground breaking research determined was that more than 90 percent of a portfolios quarterly return comes from asset allocation or portfolio structure and less than 10 percent of the portfolios return comes from what is typically considered to be manager skill. Their research suggests that the market (river) does most of the hard work and the active manager (rower) is adding less than we may expect. Whether one agrees with the study or not, it is easy to believe that it is less difficult to have positive return in a positive market than it is in a negative market. Said another way, “When the markets go up my portfolio value goes up. When markets go down my portfolio value goes down.”
Tool #5: Efficient Frontier
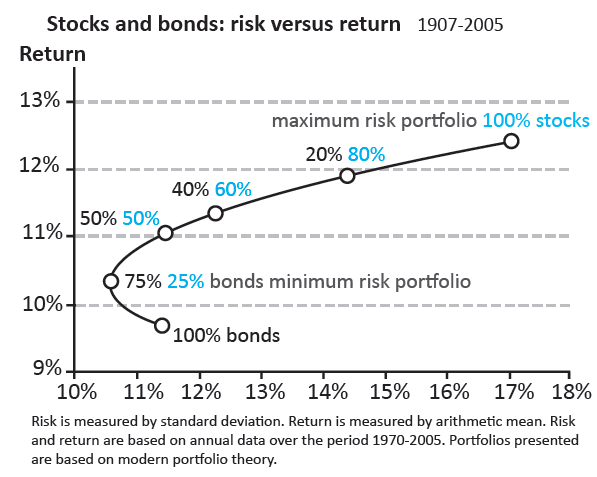
While doing graduate work in 1952 at the University of Chicago, Harry Markowitz determined that one could combine the concepts of standard deviation, diversification, correlation and asset allocation. He proved that when asset allocation is used with asset classes that have low correlation and reliable standard deviation measures, one can achieve a diversification effect. At each measure of expected return there is a com-bination of securities that has the lowest expected risk and conversely, at each measure of expected risk there is a combination of securities that has the highest expected return. Each of these points is considered to be the optimal portfolio for that level of risk and return. When those optimal risk/return points are combined together they create a line and that line is called the optimal set or efficient frontier. The conclusion is that by adding some types of risky asset classes to the portfolio the expected return can remain the same but the expected volatility can be reduced. The least risky portfolio may no longer be the lowest return portfolio. This is considered to be the closest thing to a free lunch in the investment world.
As with nearly everything I have said in these articles, these tools are neither a silver bullet solution nor are they meant to be used independent of the rest of the structure. Most of the information used in Modern Portfolio Theory is based on historical returns. That viewpoint begs the obvious question; “What if history doesn’t repeat?” Our job as advisors and investors is to determine the future value of current decisions, not the current value of past decisions.
A tool that helps us model potential future outcomes is called Monte Carlo Simulation and is the subject of our next article titled, “Investing’s Crystal Ball”. To access this article go to our home page, click on “resources” and select “articles” from the drop down box.
The Wealth That Lasts course and these articles are intended to walk an investor through the steps of the Wealth That Lasts Process. The final outcome should be a draft of the investor’s personal wealth management strategy. To this point we have developed your values and goals and determined if they were realistic given your personal circumstances. We then established your tolerance for volatility which will be used when we start making asset allocation decisions. In the next three articles we will combine additional tools and investment types and help you determine which types of investments you prefer to hold and in what amounts. We will then move on to decide whether you are going to do all of this yourself or if you are going to assemble a team. Either way we will define the roles and responsibilities involved in the proper functioning of your wealth management business. We will finish by establishing your communication plan and completing a hierarchy of your estate plan-ning needs. All of these elements will be used to design your Investment Policy Statement.
As always I appreciate your feedback. If you have questions or comments please email me at Bob.Bancroft@GlobalWMI.com or post your question by going to our home page and clicking on “ask your instructor”.